Debug React Apps with React DevTools and the Profiler
Master React DevTools: inspect component trees, edit live props and state, profile render performance, identify re-renders, and fix common warnings.
What you will learn
When your React code doesn’t behave as expected, relying only on console.log() is like searching in the dark with a tiny keychain flashlight. Modern React applications are component trees with nested state, inherited context values, hook chains, and conditional re-renders.
The official React Developer Tools browser extension gives you superpowers to inspect, manipulate, and diagnose components right inside Chrome, Firefox, or Edge.
In this lesson, you will learn:
- How to navigate the Components tab to inspect component hierarchies, props, state, and hooks.
- How to interactively edit live props and state to test edge cases in real time.
- How to use the Profiler tab (Flamegraph and Ranked charts) to spot expensive renders.
- How to enable the “Record why each component rendered” setting to eradicate wasted renders.
- How to interpret and resolve common React warnings (key warnings, uncontrolled inputs, hydration mismatches).
Installing and opening React DevTools
Install the extension from your browser’s store (Chrome Web Store, Firefox Add-ons, or Edge Add-ons) by searching for React Developer Tools.
Once installed, open your browser’s developer tools (F12 or Ctrl+Shift+I / Cmd+Option+I). You will see two new tabs:
- Components: For inspecting and modifying component instances, props, state, and context.
- Profiler: For recording render durations and detecting performance bottlenecks.
[!NOTE] The React DevTools extension icon turns blue when visiting a page running a development build of React, and dark grey for an optimized production build.
Mastering the Components tab
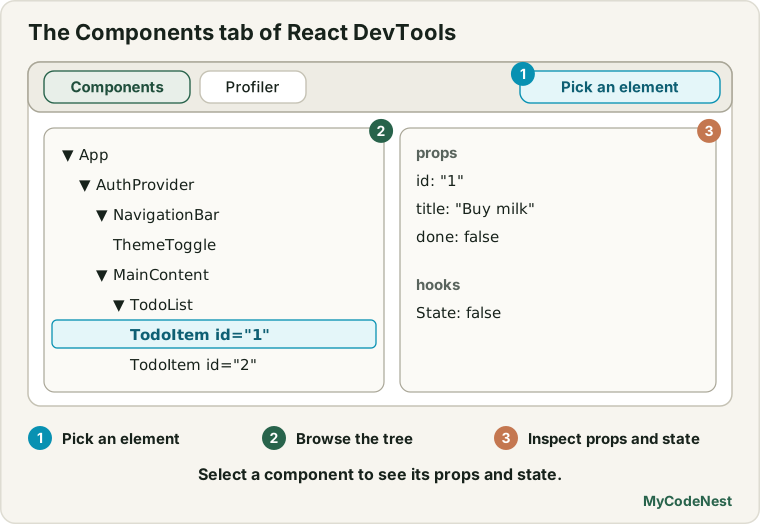
The Components tab displays your UI not as raw HTML tags (<div>, <span>), but as your actual React component hierarchy (<App>, <Navbar>, <UserCard>, <Button>).
▼ App
  ▼ AuthProvider
    ▼ NavigationBar
        ThemeToggle
    ▼ MainContent
      ▼ TodoList
        ► TodoItem (id: "1")
        ► TodoItem (id: "2")
Key features of the Components panel:
- Element Inspection: Click the target cursor icon in the top-left of the Components panel and click any element on the page to jump directly to its React component in the tree.
- Props & State Inspector: The right pane shows the currently selected component’s:
- Props: Live values passed from the parent.
- Hooks: Indexed list of
State,Reducer,Ref,Memo, and custom hook labels. - Rendered by: The owner hierarchy that rendered this component.
- Live Editing: Click on any primitive prop, string, number, or boolean in the right pane to modify it live without editing code! Toggle a modal’s
isOpenprop totrueor test an empty array on a list prop to instantly preview empty states. - Console Access via
$r: Select any component in the Components tree and switch to the standard Console tab. Type$rand press Enter. You will have full access to that component instance, its props, and its state object directly in JavaScript!
Setting Custom Display Names
By default, DevTools displays the component’s function name. When using higher-order components or anonymous forwardRef functions, components may appear as Anonymous or _c.
Use displayName or name your hook returns to make debugging clear:
// src/components/Badge.jsx
import { forwardRef } from 'react';

export const Badge = forwardRef(function Badge({ label, color }, ref) {
  return (
    <span ref={ref} className={`badge badge-${color}`}>
      {label}
    </span>
  );
});

// Explicit display name for React DevTools
Badge.displayName = 'UserStatusBadge';
In custom hooks, use useDebugValue to surface formatted debug information inside DevTools:
// src/hooks/useOnlineStatus.js
import { useState, useEffect, useDebugValue } from 'react';

export function useOnlineStatus() {
  const [isOnline, setIsOnline] = useState(navigator.onLine);

  useEffect(() => {
    const handleOnline = () => setIsOnline(true);
    const handleOffline = () => setIsOnline(false);

    window.addEventListener('online', handleOnline);
    window.addEventListener('offline', handleOffline);
    return () => {
      window.removeEventListener('online', handleOnline);
      window.removeEventListener('offline', handleOffline);
    };
  }, []);

  // Displays "OnlineStatus: Online" or "Offline" in DevTools Hooks pane
  useDebugValue(isOnline ? 'Online' : 'Offline');

  return isOnline;
}
Diagnosing performance with the Profiler tab
When an application feels laggy or stutters during scrolling or typing, the Profiler reveals exactly which components rendered, how long each render took, and why the render occurred.
1. Enable “Record why each component rendered”
Before profiling, click the gear icon (Settings ) inside the Profiler tab, navigate to the Profiler tab in the settings dialog, and check:
- Record why each component rendered.
- Highlight updates when components render.
2. Record a performance session
- Click the round blue Record button in the Profiler.
- Perform the laggy action in your app (e.g. typing a character in a filter input).
- Click the red Stop button.
3. Reading the Flamegraph and Ranked views
- Flamegraph chart: Displays the component hierarchy during each commit. Bars are color-coded:
- Grey: Did not render during this commit.
- Teal / Green: Rendered quickly with low computational cost.
- Yellow / Orange: Rendered slowly; potential optimization candidate.
- Ranked chart: Sorts every component that rendered in descending order of duration. The slowest component is at the very top.
- Hovering over a component: Hover over any bar to reveal the tooltip:
Why did this render?
• Hook 1 changed
• Props changed: (items)
This diagnostic pinpoints whether an unnecessary render was triggered by an unstable object reference or genuine state mutation.
Highlighting re-renders visually
In the Components tab settings (Settings ), enable:
- Highlight updates when components render.
When active, your browser draws colored rectangular flashes around DOM elements whenever React commits an update:
- Green: Infrequent, fast updates.
- Yellow/Red: Frequent, rapid updates within a short time window.
If an entire page flashes red every time you type a single character in a search box, state is placed too high in the tree or memoisation is missing.
Common React warnings and how to fix them
1. Warning: Each child in a list should have a unique "key" prop
// Problem: React cannot distinguish items when reordered or deleted
{todos.map((todo) => <div>{todo.text}</div>)}

// Fix: Use a stable unique ID from your data
{todos.map((todo) => <div key={todo.id}>{todo.text}</div>)}
2. Warning: A component is changing an uncontrolled input to be controlled
This happens when an input initializes with value={undefined} and later updates to a string:
// Problem: user.name is undefined on initial mount
const [user, setUser] = useState({});
<input value={user.name} onChange={(e) => setUser({ ...user, name: e.target.value })} />

// Fix: Provide a fallback empty string
<input value={user.name ?? ''} onChange={(e) => setUser({ ...user, name: e.target.value })} />
3. Warning: Can't perform a React state update on an unmounted component
This indicates an asynchronous callback (fetch, timer) resolved after the user navigated away from the page:
// Fix: Clean up active flag or AbortController in useEffect
useEffect(() => {
  const controller = new AbortController();
  fetch('/api/stats', { signal: controller.signal })
    .then(res => res.json())
    .then(data => setStats(data))
    .catch(err => {
      if (err.name !== 'AbortError') setError(err.message);
    });

  return () => controller.abort();
}, []);
Common mistakes
1. Profiling only in development mode
Development builds contain extra runtime validation checks, warnings, and unminified bundles. While great for finding why renders occur, actual millisecond durations are 2x to 5x slower than production.
To benchmark true production speed, profile a production build with profiling enabled in Vite:
// vite.config.js
export default defineConfig({
  resolve: {
    alias: {
      'react-dom/client': 'react-dom/profiling',
    },
  },
});
2. Over-optimizing green bars
If a component render takes 0.2ms and happens once on click, wrapping it in React.memo or useCallback adds code complexity for zero noticeable user benefit. Focus optimization efforts on orange bars taking 16ms+ (which drops frame rates below 60fps).
3. Forgetting $r only represents the currently selected element
If you switch components in DevTools, $r changes immediately to the newly selected component. Store it in a variable (const myComp = $r) if you want to inspect it across selections.
Practice
- Install React DevTools and inspect your application’s root component. Navigate the tree and locate your primary navigation bar.
- Select an input component in the tree, switch to your browser console, type
$r.props, and log its current props object. - Edit the state of a counter or toggle component directly inside the DevTools right-side pane to test its limits.
- Open the Profiler tab, turn on “Record why each component rendered”, record a typing interaction, and identify the slowest rendered component.
- Add
useDebugValueto a custom hook in your app and verify that the formatted label displays under the Hooks section in DevTools.
Recap
- React Developer Tools provides the Components and Profiler tabs tailored specifically for React applications.
- The Components panel lets you view component hierarchies, inspect hooks, modify live props, and test edge states in real time.
- The
$rglobal console shortcut provides instant programmatic access to the currently selected component. - The Profiler panel measures commit durations and, with “Record why each component rendered” enabled, pinpoints exact state and prop changes.
- Use
useDebugValuein custom hooks anddisplayNameon wrapped components to maintain a clean debugging surface.
Frequently asked questions
Can I use React DevTools on mobile browsers?
Mobile browsers don't support browser extensions directly, but you can use the standalone `react-devtools` npm package (`npx react-devtools`). It connects to mobile Safari or Chrome via a WebSocket bridge script.Why does a component re-render even when its props did not change?
In React, when a parent component renders, all of its child components render by default unless they are wrapped in `React.memo()`. Also, if the component consumes a Context value that updated, it will re-render regardless of props.What does the "Commit" selector at the top of the Profiler mean?
Each bar at the top of the Profiler represents a React "commit" (when React applied changes to the real DOM). You can click through each commit bar to see what rendered at each exact moment in time.Is React DevTools safe to keep active in production?
Yes. In standard production builds, React automatically strips out internal debugging hooks and state manipulation hooks, preventing external users from modifying your app's state arbitrarily.See also: