Production Debugging and Monitoring for React Apps
Master production debugging and monitoring in React: configure source maps, capture errors with createRoot callbacks and boundaries, and track Web Vitals.
What you will learn
Even the most thoroughly tested applications encounter unexpected bugs in production: an obscure browser version, a flaky cellular network, an unexpected null value from an external API, or an unhandled promise rejection.
In production, JavaScript code is minified and mangled into single-letter variable names, making raw browser error reports like TypeError: Cannot read properties of undefined (reading 'e') at a.js:1:3829 practically impossible to decipher without proper tooling.
In this lesson, you will learn:
- How source maps bridge minified production code back to your original source files.
- How to configure React 19’s
createRooterror callbacks:onCaughtError,onUncaughtError, andonRecoverableError. - How to combine Error Boundaries with global monitoring to prevent blank white screens of death.
- How to build a vendor-neutral client-side telemetry reporter to log uncaught errors and promise rejections.
- How to monitor real user performance metrics using Core Web Vitals (
web-vitals).
The Production Debugging Dilemma: Minified Stack Traces
Consider what happens when a production user clicks a broken button:
Uncaught TypeError: t.toUpperCase is not a function
    at Q (vendor-Bc99.js:2:14920)
    at Object.ua (index-Df11.js:1:4301)
From this stack trace alone, you cannot determine which component failed, which prop was invalid, or which line in your source repository caused the crash.
How Source Maps Solve This
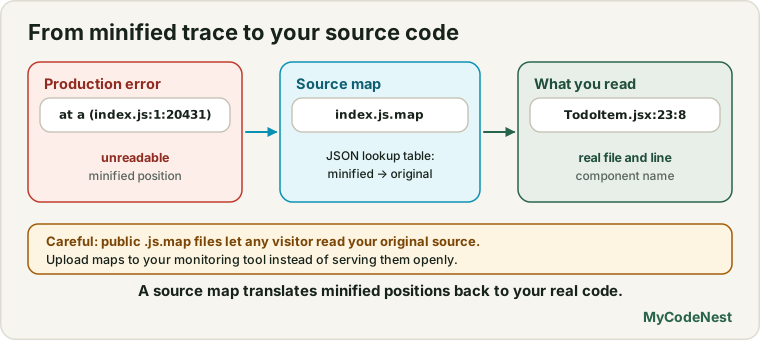
A Source Map (.js.map) is a JSON mapping file that provides a bidirectional translation between your minified output bundle and your original uncompiled JSX/TypeScript source files.
In Vite, you can generate source maps during npm run build:
// vite.config.js
import { defineConfig } from 'vite';
import react from '@vitejs/plugin-react';

export default defineConfig({
  plugins: [react()],
  build: {
    // Generate separate source map files
    sourcemap: true,
  },
});
When DevTools detects a source map reference at the bottom of a JavaScript file (//# sourceMappingURL=index.js.map), it automatically reconstructs your original file tree in the Sources tab, allowing you to set breakpoints on real JSX code and inspect readable variable names.
[!WARNING] Source Map Security: If you upload
.js.mapfiles directly to your public web server, any visitor can inspect your original source code. In enterprise applications, configure your build to upload.js.mapfiles privately to your error monitoring service (such as Sentry, Datadog, or Bugsnag) and delete them from the publicdist/directory before deployment.
React 19 Global Error Callbacks in createRoot
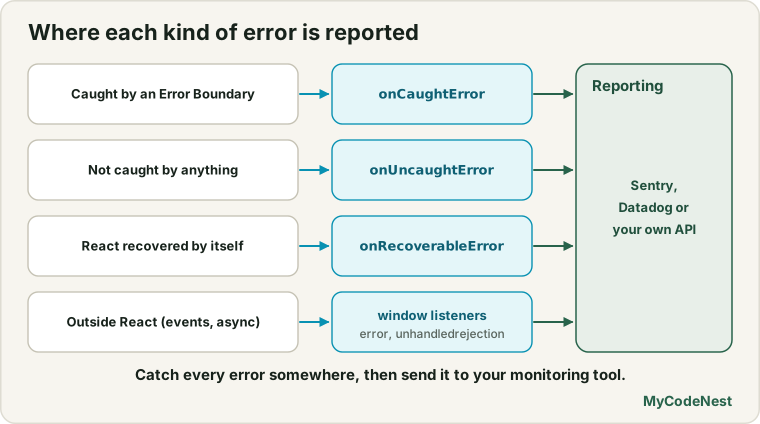
Historically, catching errors in React required wrapping everything in class-based Error Boundaries, but errors occurring outside boundaries or during asynchronous events had no unified React handling.
React 19 introduces three first-class error reporting options directly in createRoot:
// src/main.jsx
import React from 'react';
import ReactDOM from 'react-dom/client';
import App from './App';
import { reportErrorToService } from './services/telemetry';

const root = ReactDOM.createRoot(document.getElementById('root'), {
  // 1. Errors caught by an ErrorBoundary
  onCaughtError(error, errorInfo) {
    reportErrorToService({
      type: 'CAUGHT_ERROR',
      error,
      componentStack: errorInfo.componentStack,
    });
  },

  // 2. Errors that were NOT caught by any ErrorBoundary (crashed the root)
  onUncaughtError(error, errorInfo) {
    reportErrorToService({
      type: 'UNCAUGHT_ROOT_ERROR',
      error,
      componentStack: errorInfo.componentStack,
    });
  },

  // 3. Recoverable errors (e.g. hydration mismatches or Suspense fallbacks)
  onRecoverableError(error, errorInfo) {
    console.warn('Recoverable React error:', error);
    reportErrorToService({
      type: 'RECOVERABLE_ERROR',
      error,
      componentStack: errorInfo?.componentStack,
    });
  },
});

root.render(
  <React.StrictMode>
    <App />
  </React.StrictMode>
);
Why these three callbacks matter:
onCaughtError: Notified when a child Error Boundary catches an exception. You can log it silently to your telemetry service while the user sees a friendly fallback UI.onUncaughtError: Fires when an exception bubbles to the very top without being intercepted by an Error Boundary, unmounting the root tree.onRecoverableError: Fires when React encounters an error it can recover from automatically (such as a hydration mismatch where React discards the server HTML and re-renders client-side).
Global Browser Error Listeners
Not all errors originate inside the React component render lifecycle. Errors can occur inside setTimeout, asynchronous network handlers, or third-party analytics scripts.
Set up global window listeners in your entry point:
// src/services/telemetry.js

export function initGlobalErrorLogging() {
  // Catch unhandled runtime JavaScript exceptions
  window.addEventListener('error', (event) => {
    reportErrorToService({
      type: 'UNHANDLED_EXCEPTION',
      message: event.message,
      filename: event.filename,
      lineno: event.lineno,
      colno: event.colno,
      error: event.error,
    });
  });

  // Catch unhandled Promise rejections (e.g. failed unhandled fetch calls)
  window.addEventListener('unhandledrejection', (event) => {
    reportErrorToService({
      type: 'UNHANDLED_PROMISE_REJECTION',
      reason: event.reason,
    });
  });
}

// Vendor-neutral telemetry dispatcher
export function reportErrorToService(payload) {
  // Avoid reporting errors in local development
  if (import.meta.env.DEV) {
    console.group('[Telemetry Dev Log]');
    console.error(payload);
    console.groupEnd();
    return;
  }

  // In production, send via navigator.sendBeacon or fetch keepalive
  const report = {
    ...payload,
    url: window.location.href,
    userAgent: navigator.userAgent,
    timestamp: new Date().toISOString(),
  };

  const endpoint = import.meta.env.VITE_TELEMETRY_ENDPOINT;
  if (!endpoint) return;

  // sendBeacon ensures delivery even if user closes the tab immediately
  const blob = new Blob([JSON.stringify(report)], { type: 'application/json' });
  if (navigator.sendBeacon) {
    navigator.sendBeacon(endpoint, blob);
  } else {
    fetch(endpoint, {
      method: 'POST',
      body: blob,
      keepalive: true,
    }).catch(() => {
      // Silently fail to avoid recursion
    });
  }
}
Monitoring Performance: Core Web Vitals
Monitoring is not just about errors—it is also about speed. If pages take 8 seconds to become interactive, users leave before encountering an error.
Google’s Core Web Vitals measure real-world user experience:
- LCP (Largest Contentful Paint): Loading speed. (Target: $\le 2.5\text{s}$)
- INP (Interaction to Next Paint): User responsiveness to clicks/taps. (Target: $\le 200\text{ms}$)
- CLS (Cumulative Layout Shift): Visual stability. (Target: $\le 0.1$)
Measuring Web Vitals in a Vite React app
Install the official Google web-vitals package:
npm install web-vitalsLog metrics to your telemetry endpoint:
// src/services/vitals.js
import { onCLS, onINP, onLCP, onFCP, onTTFB } from 'web-vitals';

function sendVitalsMetric(metric) {
  const body = JSON.stringify({
    name: metric.name,
    value: metric.value,
    rating: metric.rating, // 'good' | 'needs-improvement' | 'poor'
    delta: metric.delta,
    id: metric.id,
    url: window.location.pathname,
  });

  const endpoint = import.meta.env.VITE_VITALS_ENDPOINT;
  if (endpoint && navigator.sendBeacon) {
    navigator.sendBeacon(endpoint, new Blob([body], { type: 'application/json' }));
  }
}

export function reportWebVitals() {
  onCLS(sendVitalsMetric);
  onINP(sendVitalsMetric);
  onLCP(sendVitalsMetric);
  onFCP(sendVitalsMetric);
  onTTFB(sendVitalsMetric);
}
Initialize both telemetry and vitals in your main.jsx:
// src/main.jsx
import { initGlobalErrorLogging } from './services/telemetry';
import { reportWebVitals } from './services/vitals';

initGlobalErrorLogging();
reportWebVitals();
Common mistakes
1. Letting telemetry reporting throw uncaught errors
If your reportErrorToService function throws an error (e.g. failing fetch or JSON serialization of circular objects), it triggers another error event, resulting in an infinite crash loop. Always wrap telemetry code in try...catch and never re-throw.
2. Logging personally identifiable information (PII)
Never log raw form inputs, passwords, credit cards, or query tokens (?token=secret123) to an external error logger. Sanitize error payloads before transmission.
3. Exposing public source maps with secret comments
Ensure that development comments or sensitive endpoints are not left visible in publicly served .js.map files. Use private source map hosting for proprietary production applications.
Practice
- Configure
build.sourcemap: truein your Vite configuration and build your app. Open the production preview in Chrome and locate your original React components in the Sources panel. - Wire up
onCaughtErrorandonUncaughtErrorinside yourReactDOM.createRootinitialization insrc/main.jsx. - Create a test component with a button that deliberately throws an unhandled error inside a click handler. Verify that your global
window.addEventListener('error')intercepts it. - Trigger an unhandled Promise rejection (
Promise.reject('Test rejection')) and verify that yourunhandledrejectionlistener captures the event. - Install
web-vitalsand log your site’s LCP and INP metrics to the developer console to evaluate page speed.
Recap
- Source maps (
.js.map) translate minified production code back to readable JSX files with original variable names and line numbers. - React 19’s
createRootprovidesonCaughtError,onUncaughtError, andonRecoverableErrorfor clean, centralized framework error interception. - Use
window.addEventListener('error')andunhandledrejectionto capture errors outside the React rendering tree. - Use
navigator.sendBeacon()withkeepalive: trueto reliably deliver telemetry packets even during page unload. - Track real-world page speed and responsiveness using Google’s Core Web Vitals (
web-vitals).
Frequently asked questions
What is the difference between an Error Boundary and `onCaughtError`?
An Error Boundary is a React UI component that catches rendering errors in its child subtree and renders a visible fallback UI (like "Something went wrong"). The `onCaughtError` callback in `createRoot` is a logging hook invoked whenever an Error Boundary catches an error, making it the ideal place to dispatch telemetry data to a server.Why use `navigator.sendBeacon` instead of standard `fetch` for error reporting?
Standard `fetch()` requests can be cancelled by the browser if the user navigates away or closes the tab immediately after an error occurs. `navigator.sendBeacon()` queues the request asynchronously in the browser process itself, guaranteeing transmission without delaying page unload.What is a recoverable error in React?
A recoverable error occurs when React encounters a mismatch (for example, server-rendered HTML differing from client-rendered JSX during hydration) and successfully re-renders the component client-side without crashing the application.Can I use services like Sentry or LogRocket with this approach?
Yes! Commercial error tracking platforms provide React SDKs that plug directly into these exact mechanisms (`ErrorBoundary` components and `createRoot` options).See also: