Project 3: Build a Dashboard That Loads API Data
Build a React product dashboard: parallel API requests, stat cards, category bars, search, category filter, pagination, and separate loading and error states.
What you will build
Dashboards are one of the most common things developers build with React: a page that loads data from a server and shows it as numbers, charts and tables. In this project you will build a product dashboard with real API data.
Your finished app will show:
- Four stat cards: number of products, average price, average rating, and how many are low on stock.
- A small bar chart of the five biggest categories, made with plain HTML and CSS.
- A search box (debounced) and a category filter.
- A table of products with pagination.
- Proper loading and error states for each part, with Try again buttons.
This project puts together the whole data section: fetching, production API handling (retries, timeouts, cancelling, caching, stale-while-loading), and the custom Hooks you built, useApi and useDebounce. It also uses the design skills from the product search project: derived data and controlled filters.
Here is the page in text form:
Product Dashboard

[ Products ]  [ Average price ]  [ Average rating ]  [ Low stock (under 10) ]
[   194    ]  [    $....      ]  [      ....      ]  [          ..          ]

Top categories
womens-dresses  ████████████  ..
...

Search [         ]   Category [All categories v]

Title             Category        Price    Rating   Stock
...
[Previous]  Page 1 of 20  [Next]
(Your numbers come from the live API and can change a little over time.)
Before you start
You need these files from earlier lessons. If you do not have them, go back and create them:
| File | From lesson |
|---|---|
src/api/http.js (fetchJson, cachedFetchJson, HttpError) |
Production-Ready API Handling |
src/hooks/useApi.js |
Production-Ready API Handling |
src/hooks/useDebounce.js |
Custom Hooks |
The API
We use DummyJSON again. Three endpoints are enough:
| Need | Request |
|---|---|
| All products, for the statistics | /products?limit=0&select=title,category,price,rating,stock |
| The list of categories | /products/categories |
| One page of products | /products?limit=10&skip=0&select=..., or /products/search?q=...&..., or /products/category/{slug}?... |
Two details from the API documentation make this project possible:
limit=0returns all items. We use it to get every product in one request for the statistics. Theselectoption keeps each item small, so the answer is not huge.- The categories endpoint returns objects with a
slug(for URLs), aname(to display) and aurl.
One limitation shapes our design: the search endpoint and the category endpoint are separate. You can search or filter by category, but not both at once. So our page uses a simple rule: while the search box has text, search wins and the category select is disabled, with a hint. This is a real-world lesson: design your interface around what your API can do.
Think first: components and state
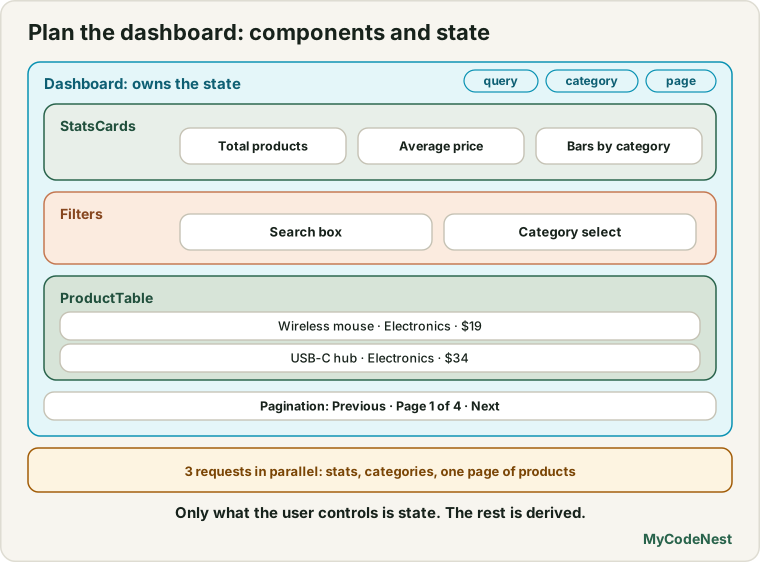
Before coding, plan (the steps from the product search project):
Dashboard                owns: query, category, page   (the only state)
├── StatsCards           shows numbers and bars from ALL products
├── Filters              search box and category select
├── ProductTable         shows one page of products
└── Pagination           Previous, "Page x of y", Next
State is only what the user controls: query, category and page. Everything else is derived: the URL to request, the stats (calculated from the data), the number of pages (calculated from total).
Three requests, one for each part of the page:
- the stats (all products),
- the categories (for the select),
- the current page of products.
They do not depend on each other, so they are sent in parallel. Each has its own loading and error state. If the table fails, the stat cards still work. This is called partial failure handling, and it makes a dashboard feel much more robust than one big “loading” screen.
Step 1: build the URLs in one place
URLs are derived data: a function of the state. Keep that function in its own file, src/api/products.js:
const BASE_URL = "https://dummyjson.com";
const FIELDS = "title,category,price,rating,stock";

export const PAGE_SIZE = 10;

export function categoriesUrl() {
  return `${BASE_URL}/products/categories`;
}

export function statsUrl() {
  return `${BASE_URL}/products?limit=0&select=${FIELDS}`;
}

export function productsUrl({ query, category, page }) {
  const paging = `limit=${PAGE_SIZE}&skip=${(page - 1) * PAGE_SIZE}&select=${FIELDS}`;

  if (query) {
    return `${BASE_URL}/products/search?q=${encodeURIComponent(query)}&${paging}`;
  }

  if (category !== "all") {
    return `${BASE_URL}/products/category/${encodeURIComponent(category)}?${paging}`;
  }

  return `${BASE_URL}/products?${paging}`;
}
This file has no React in it, so it is easy to read and to test. The if order encodes our rule: search first, then category, then everything. User text always goes through encodeURIComponent.
Step 2: a reusable error box
src/components/ErrorBox.jsx:
function ErrorBox({ message, onRetry }) {
  return (
    <div role="alert" className="error-box">
      <p>Something went wrong: {message}</p>
      <button onClick={onRetry}>Try again</button>
    </div>
  );
}

export default ErrorBox;
Three parts of the page can fail, so one small shared component avoids repeating this markup. role="alert" makes screen readers announce it.
Step 3: the stat cards and category bars
src/components/StatsCards.jsx:
import ErrorBox from './ErrorBox.jsx';

function average(numbers) {
  return numbers.reduce((sum, number) => sum + number, 0) / numbers.length;
}

function Card({ label, value }) {
  return (
    <div className="card">
      <span className="card__label">{label}</span>
      <strong className="card__value">{value}</strong>
    </div>
  );
}

function StatsCards({ result }) {
  const { status, data, error, retry } = result;

  if (data === null) {
    return status === "error" ? (
      <ErrorBox message={error.message} onRetry={retry} />
    ) : (
      <p>Loading statistics...</p>
    );
  }

  const items = data.products;

  if (items.length === 0) {
    return <p>No data available.</p>;
  }

  const lowStock = items.filter((product) => product.stock < 10).length;

  const counts = {};
  for (const product of items) {
    counts[product.category] = (counts[product.category] ?? 0) + 1;
  }
  const topCategories = Object.entries(counts)
    .sort((a, b) => b[1] - a[1])
    .slice(0, 5);
  const biggest = topCategories[0][1];

  return (
    <section aria-label="Statistics">
      <div className="cards">
        <Card label="Products" value={data.total} />
        <Card label="Average price" value={`$${average(items.map((p) => p.price)).toFixed(2)}`} />
        <Card label="Average rating" value={average(items.map((p) => p.rating)).toFixed(2)} />
        <Card label="Low stock (under 10)" value={lowStock} />
      </div>

      <h2>Top categories</h2>
      <ul className="bars">
        {topCategories.map(([name, count]) => (
          <li key={name}>
            <span className="bars__name">{name}</span>
            <span className="bars__bar" style={{ width: `${(count / biggest) * 100}%` }} />
            <span className="bars__count">{count}</span>
          </li>
        ))}
      </ul>
    </section>
  );
}

export default StatsCards;
This component receives the whole result of a useApi call (status, data, error, retry) and decides what to show. Let us read it.
- Error handling comes first when there is no data.
data === nullmeans the first load has not succeeded yet. If the status is"error", show the error box. Otherwise it is still loading. - All the numbers are derived. Nothing is stored in state. The average price, the average rating and the low-stock count are calculated from the array on every render.
average()is a small helper: sum withreduce, divide by the length. (See the array methods lesson.) Notice the guard against an empty array above it: dividing by zero would giveNaN.- Counting categories: the loop builds an object like
{ beauty: 5, laptops: 6 }.?? 0gives0the first time a category appears (see nullish coalescing). ThenObject.entriesturns it into pairs,sortputs the biggest first, andslice(0, 5)keeps the top five. - The bar chart is just CSS. Each bar is an empty
spanwhose width is a percentage of the biggest category ((count / biggest) * 100). This is an example of using an inlinestylefor a value that comes from data, as the styling lesson described. No chart library is needed for a simple chart.
Step 4: the filters
src/components/Filters.jsx:
function Filters({ query, onQueryChange, category, onCategoryChange, categories }) {
  const searching = query.trim() !== "";

  return (
    <form className="filters" onSubmit={(event) => event.preventDefault()}>
      <label htmlFor="search">Search</label>
      <input
        id="search"
        type="search"
        value={query}
        onChange={(event) => onQueryChange(event.target.value)}
      />

      <label htmlFor="category">Category</label>
      <select
        id="category"
        value={category}
        onChange={(event) => onCategoryChange(event.target.value)}
        disabled={searching || categories.data === null}
      >
        <option value="all">All categories</option>
        {categories.data?.map((item) => (
          <option key={item.slug} value={item.slug}>
            {item.name}
          </option>
        ))}
      </select>

      {searching && <p>Clear the search to filter by category.</p>}
    </form>
  );
}

export default Filters;
This is a controlled component with no state of its own, like ProductFilters in the last project. The new idea is that its options come from loaded data:
categories.data?.map(...)uses optional chaining (see the optional chaining lesson): while the categories are loading,dataisnull, and the?.makes the whole expressionundefined, so no options are rendered.- The select is
disabledwhile the categories load, and while the user is searching (our rule).searchingis calculated fromquery.
Step 5: the table
src/components/ProductTable.jsx:
import ErrorBox from './ErrorBox.jsx';

function ProductTable({ result }) {
  const { status, data, error, isStale, retry } = result;

  if (status === "error") {
    return <ErrorBox message={error.message} onRetry={retry} />;
  }

  if (data === null) {
    return <p>Loading products...</p>;
  }

  if (data.products.length === 0) {
    return <p>No products match your search.</p>;
  }

  return (
    <div className="table-wrap" aria-busy={status === "loading"} style={{ opacity: isStale ? 0.5 : 1 }}>
      <table>
        <caption>
          Showing {data.products.length} of {data.total} products
        </caption>
        <thead>
          <tr>
            <th scope="col">Title</th>
            <th scope="col">Category</th>
            <th scope="col">Price</th>
            <th scope="col">Rating</th>
            <th scope="col">Stock</th>
          </tr>
        </thead>
        <tbody>
          {data.products.map((product) => (
            <tr key={product.id} className={product.stock < 10 ? "low-stock" : undefined}>
              <td>{product.title}</td>
              <td>{product.category}</td>
              <td>${product.price.toFixed(2)}</td>
              <td>{product.rating}</td>
              <td>{product.stock}</td>
            </tr>
          ))}
        </tbody>
      </table>
    </div>
  );
}

export default ProductTable;
Notes:
- The order of the checks matters: error first, then the first load, then the empty result, then the table. If an error happens on page 3, the user sees the error, not the old page 2 that
useApikeeps indata. isStaledims the old rows while the next page loads (the stale-while-loading pattern), andaria-busytells assistive technology that the content is updating.- A real HTML
<table>with<caption>and<th scope="col">is accessible. Screen readers can announce the column for each cell. (See the HTML tables lesson.) - Rows with low stock get a CSS class, so you can highlight them.
Step 6: pagination
src/components/Pagination.jsx:
function Pagination({ page, totalPages, onPageChange }) {
  return (
    <nav aria-label="Pagination" className="pagination">
      <button onClick={() => onPageChange(page - 1)} disabled={page <= 1}>
        Previous
      </button>
      <span>
        Page {page} of {totalPages}
      </span>
      <button onClick={() => onPageChange(page + 1)} disabled={page >= totalPages}>
        Next
      </button>
    </nav>
  );
}

export default Pagination;
Step 7: the dashboard
src/components/Dashboard.jsx is the only component with state:
import { useState } from 'react';
import { useApi } from '../hooks/useApi.js';
import { useDebounce } from '../hooks/useDebounce.js';
import { PAGE_SIZE, categoriesUrl, statsUrl, productsUrl } from '../api/products.js';
import StatsCards from './StatsCards.jsx';
import Filters from './Filters.jsx';
import ProductTable from './ProductTable.jsx';
import Pagination from './Pagination.jsx';

function Dashboard() {
  const [query, setQuery] = useState("");
  const [category, setCategory] = useState("all");
  const [page, setPage] = useState(1);
  const debouncedQuery = useDebounce(query.trim(), 300);

  const stats = useApi(statsUrl());
  const categories = useApi(categoriesUrl());
  const products = useApi(productsUrl({ query: debouncedQuery, category, page }));

  const totalPages = products.data
    ? Math.max(1, Math.ceil(products.data.total / PAGE_SIZE))
    : 1;

  function handleQueryChange(value) {
    setQuery(value);
    setPage(1);
  }

  function handleCategoryChange(value) {
    setCategory(value);
    setPage(1);
  }

  return (
    <main className="dashboard">
      <h1>Product Dashboard</h1>
      <StatsCards result={stats} />
      <Filters
        query={query}
        onQueryChange={handleQueryChange}
        category={category}
        onCategoryChange={handleCategoryChange}
        categories={categories}
      />
      <ProductTable result={products} />
      <Pagination page={page} totalPages={totalPages} onPageChange={setPage} />
    </main>
  );
}

export default Dashboard;
This is short, because every piece has a clear job. Look at what is not here: no loading flags, no error state, no effects, no fetch. The useApi Hook (with the retries, timeout, cancel and cache from the production lesson) hides all that.
- Three
useApicalls = three parallel requests. React starts all three Effects as the component first appears, so the requests do not wait for each other. When you open the Network tab, you will see them start at the same time. - The
statsUrl()andcategoriesUrl()never change, so those requests are made once and cached. Only theproductsURL changes with the state. - Changing the search or the category also resets the page to 1, inside the event handlers (not in an Effect).
- The page count is derived from
products.data.total, withMath.max(1, ...)so an empty result still showsPage 1 of 1.
Finally, replace src/App.jsx:
import './App.css';
import Dashboard from './components/Dashboard.jsx';

function App() {
  return <Dashboard />;
}

export default App;
Styling
Replace the content of src/App.css:
.dashboard {
  max-width: 900px;
  margin: 0 auto;
  padding: 24px 16px;
  text-align: left;
}

.cards {
  display: grid;
  grid-template-columns: repeat(auto-fit, minmax(160px, 1fr));
  gap: 12px;
  margin-bottom: 24px;
}

.card {
  display: flex;
  flex-direction: column;
  gap: 4px;
  padding: 16px;
  border: 1px solid #ccc;
  border-radius: 12px;
}

.card__label {
  font-size: 0.85rem;
  opacity: 0.7;
}

.card__value {
  font-size: 1.6rem;
}

.bars {
  list-style: none;
  margin: 0 0 24px;
  padding: 0;
}

.bars li {
  display: grid;
  grid-template-columns: 160px 1fr 40px;
  align-items: center;
  gap: 8px;
  margin-bottom: 6px;
}

.bars__bar {
  display: block;
  height: 14px;
  border-radius: 7px;
  background: #646cff;
}

.filters {
  display: flex;
  flex-wrap: wrap;
  align-items: center;
  gap: 8px;
  margin-bottom: 16px;
}

.table-wrap {
  overflow-x: auto;
}

table {
  width: 100%;
  border-collapse: collapse;
}

th,
td {
  padding: 8px;
  border-bottom: 1px solid #ccc;
  text-align: left;
}

.low-stock td {
  color: #d93025;
}

.pagination {
  display: flex;
  align-items: center;
  justify-content: center;
  gap: 16px;
  margin-top: 16px;
}

.error-box {
  padding: 12px 16px;
  border: 1px solid #d93025;
  border-radius: 8px;
}
The grid with auto-fit and minmax makes the cards wrap on narrow screens (see the CSS Grid lessons), and overflow-x: auto lets the table scroll sideways on a phone instead of breaking the layout.
Try your dashboard
Run npm run dev and test these things:
- Loading: you see
Loading statistics...andLoading products...at the same time, because the requests run in parallel. Then the cards, the bars and the table appear independently. - Stat cards: four numbers, with the average price and rating formatted to two decimals.
- Bars: five categories with bars sized relative to the largest.
- Table: ten rows and the caption
Showing 10 of 194 products(your number may differ slightly). Rows with stock under 10 are red. Previous is disabled on page 1. - Next page: the old rows dim for a moment, then the next ten appear. Going Previous is instant (cached).
- Category: pick
Laptops. The table shows only laptops, the caption changes, andPage 1 of ...is recalculated. The stat cards stay the same, because they describe all products. - Search: type
phone. The category select becomes disabled with the hint, and after a short pause the table shows only matching products. Clear the box: the category select works again. - No results: search for
zzzzto see the empty message. - Errors: turn on Offline in DevTools and reload. After the retries (about one second of waiting), each part shows its own error box with Try again. Go back online, click one Try again, and only that part recovers.
We tested the project, with the lesson’s own code, against a local server that follows DummyJSON’s response shapes. The three requests started together. The cards showed the right totals, average price, average rating and low-stock count (we calculated the expected numbers separately and compared). The category and search endpoints were called with the right URLs, and the special characters in a search were encoded. When we made only the category request fail, the table showed an error box with a Try again button, the stat cards stayed visible, and clicking Try again loaded the table.
Common mistakes
1. One big loading state for the whole page. If one request is slow or fails, the whole dashboard is blocked. Give each part its own state.
2. Requests that wait for each other for no reason. Independent requests should run in parallel, not one after another.
3. Storing calculated numbers in state. Averages, counts and page numbers should be derived from the data.
4. Dividing by zero. average([]) is NaN. Guard against empty data.
5. Forgetting to reset the page when the search or the category changes.
6. Not encoding user text in URLs. Always use encodeURIComponent.
7. Mixing endpoints that cannot be combined. The API cannot search inside a category, so the interface must not pretend it can.
8. Hiding errors. Show a clear message and a Try again button for every part that can fail.
9. Showing stale data when the latest request failed. Check the error before showing data.
10. Making the chart too complex too early. A bar made from a styled span is often enough. Use a chart library only when you need more.
Practice (extend the project)
-
Add a fifth stat card: Out of stock (stock equal to
0). Calculate it from the same data. -
Add a Rows per page select (5, 10, 20). What must change in
productsUrl, intotalPagesand in the page reset? -
Predict, then check: Turn off the network for the stats request only (use DevTools request blocking on the
limit=0URL). Which parts of the page still work? Which show an error? -
Show the average rating with a small star symbol and colour it green above
4and red below3. -
Sort: make the table headers clickable and sort the current page on the client. Think: why does sorting only the current page not give a true “sort all products”? Look at the API documentation to see what the server can sort.
-
Debug: The table never updates after you choose a category. This is the Dashboard code. What is missing?
const products = useApi(productsUrl({ query: debouncedQuery, category: "all", page })); -
Make the bars clickable: clicking a category name selects it in the filter. Which state changes? Does the search have to be cleared?
-
Add a Refresh button that reloads all three parts. Think about the cache: what does clicking it need to do for the products and stats requests to really go to the server?
Recap
- You built a dashboard with three parallel requests, each with its own loading and error states and a retry.
- State is only
query,categoryandpage. The URLs, the stats, the bars and the page count are derived. - Keep URL-building in a pure function (
productsUrl), and always encode user text. - Design the interface around the API’s limits: search or category, not both.
- Components receive the whole
useApiresult and handle loading, error, empty and data in the right order (error first). - Stats come from all products (
limit=0) and are computed withreduce,filter,sortandslice. A simple CSS bar chart needs no library. - Reuse your Hooks (
useApi,useDebounce): the dashboard component itself has nofetchand nouseEffect. - Next you will learn routing: how to turn single-page apps into apps with several pages and URLs.
Frequently asked questions
Why not load everything with one request?
The three parts have different needs and change at different times. Separate requests can run in parallel, fail independently, and be cached separately. One combined request would be slower to start, and a failure would hide the whole dashboard.
Why are the stats not affected by the filters?
By design, the cards describe all products, while the filters control the table. You could also make the cards follow the filters by calculating them from the current filtered data. Decide what your users expect and keep it consistent.
Is it fine to download all products for the statistics?
For a few hundred small items, yes, especially with select to limit the fields. For huge data sets you would ask the server for the numbers instead, for example with a special statistics endpoint, because downloading everything would be slow.
Why not use TanStack Query here?
You can, and it would shorten the data code. We used our own useApi Hook to practise the ideas and to keep the project free of extra packages. Replacing useApi with useQuery is a good exercise.
Why is the category select disabled while searching?
The API has separate endpoints for search and for category, and they cannot be combined. Disabling the select (and explaining why) is more honest than letting the user choose something that would be ignored.
How could I show a real chart?
For simple cases, styled elements like our bars or an inline SVG are enough. For complex charts with axes, tooltips and animation, a charting library is a better choice. Learn the data side first, as in this project, and the library is only a different way to draw the same numbers.
See also: Production-Ready API Handling, Custom Hooks, Product Search Project, HTML Tables